India-US Trade and Investment
Bilateral Trade
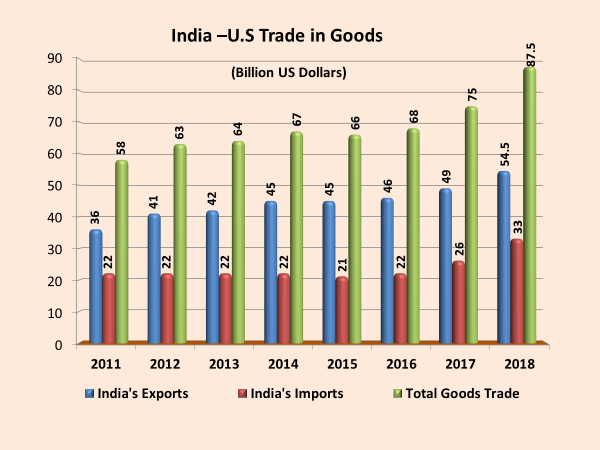
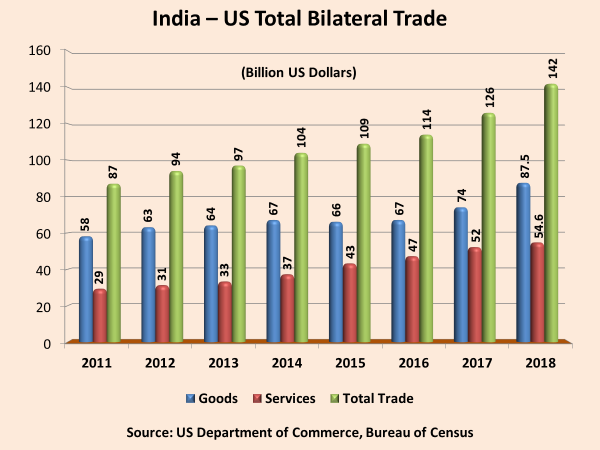
Rapidly expanding trade and commercial linkages between India and U.S. form an important component of the multi-faceted partnership between the two countries. Total bilateral trade (goods and services) between India and US increased at a CAGR of 11.5% from $20 billion in the year 2000 to $142 billion in the year 2018. In this period, the growth in bilateral trade was accelerated by services trade, which grew at a CAGR of 13.4%. Goods trade grew at a CAGR of 10.6%. During the year 2018, goods trade contributed to 61.6% and trade in services contributed to 38.4% of the total India-US bilateral trade of $142 billion.
Goods Trade: Starting from a modest $14 billion in 2000, the bilateral trade in goods has increased to $87.5 billion in 2018 (CAGR of 10.6%), making U.S. our second largest trading partner. Of this, India exported $54.4 billion to US and imported $33.12 billion from US. Trade in goods during the year 2018 was $87.53 billion as compared to $74.33 billion during the year 2017, which is an increase of 17.8%. During the period January –October 2019, trade in goods grew by 5% to $ 77.5 billion from $ 73.8 billion during the corresponding period in 2018.
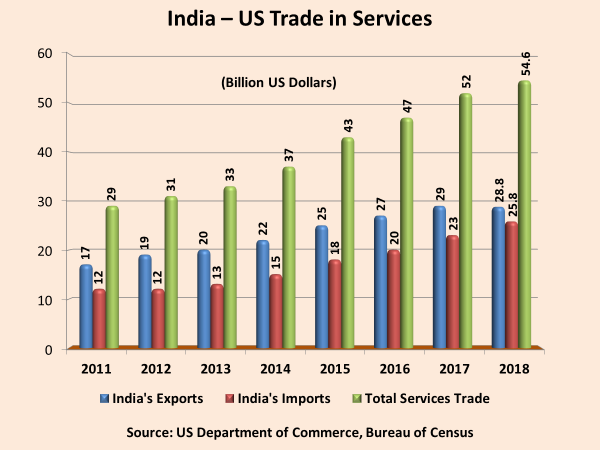
Trade in Services: Bilateral trade in services has grown at a very fast pace since the year 2000, increasing from a mere $6 Billion in 2000 to $54.6 billion in the year 2018 (CAGR of 13.1%). Of this, India’s exports of services to the U.S. were valued at $28.8 billion and India's imports of services from US were valued at $25.8 billion. Trade in Services during the year 2018 was $ 54.56 billion as compared to $51.9 billion during 2017, which is an increase of 5.2%. During the period January – Sept 2019, trade in services grew by 1.5% to 41.47 billion from $ 40.85 billion during the corresponding period in 2018.
India US Trade in Goods ($ Billions)
|
|
2013
|
2014
|
2015
|
2016
|
2017
|
2018
|
|
India's exports to US
|
41.8
|
45.4
|
44.8
|
46.0
|
48.6
|
54.4
|
|
% change
|
3.2
|
8.5
|
-1.2
|
2.8
|
5.7
|
11.9
|
|
India’s imports from US
|
21.8
|
21.5
|
21.5
|
21.7
|
25.7
|
33.1
|
|
% change
|
-1.3
|
-1.4
|
-0.2
|
0.9
|
18.7
|
28.9
|
|
India US Trade in Goods
|
63.6
|
66.9
|
66.3
|
67.7
|
74.3
|
87.5
|
|
% change
|
1.6
|
5.2
|
-0.9
|
2.1
|
9.8
|
17.8
|
India - US Trade in Services ($ Billions)
|
|
2013
|
2014
|
2015
|
2016
|
2017
|
2018
|
|
India's exports to US
|
20.4
|
22.4
|
24.6
|
25.8
|
28.1
|
28.8
|
|
% change
|
8.5
|
9.8
|
9.8
|
4.9
|
8.9
|
2.2
|
|
India’s imports from US
|
13.3
|
15.2
|
18.4
|
20.6
|
23.7
|
25.8
|
|
% change
|
8.1
|
14.3
|
21.0
|
12.0
|
15
|
8.6
|
|
India - US Trade in Services
|
33.7
|
37.6
|
43.0
|
46.4
|
51.9
|
54.6
|
|
% change
|
8.4
|
11.6
|
14.4
|
8.0
|
11.6
|
5.2
|
India – US Total Bilateral Trade ($ Billions)
| |
2013
|
2014
|
2015
|
2016
|
2017
|
2018
|
|
India's exports to US
|
62.2
|
67.8
|
69.4
|
71.8
|
77.3
|
83.17
|
|
% change
|
4.9
|
9.0
|
2.4
|
3.5
|
7.7
|
7.6
|
|
India’s imports from US
|
35.1
|
36.7
|
39.6
|
42.2
|
48.8
|
58.92
|
|
% change
|
2.0
|
4.6
|
7.9
|
6.6
|
15.6
|
20.7
|
|
India – US Total Bilateral Trade
|
97.3
|
104.5
|
109.0
|
114.0
|
126.1
|
142.09
|
|
% change
|
3.8
|
7.4
|
4.3
|
4.6
|
10.6
|
12.7
|
Source: US Department of Commerce, US Census Bureau and US Bureau of Economic Analysis
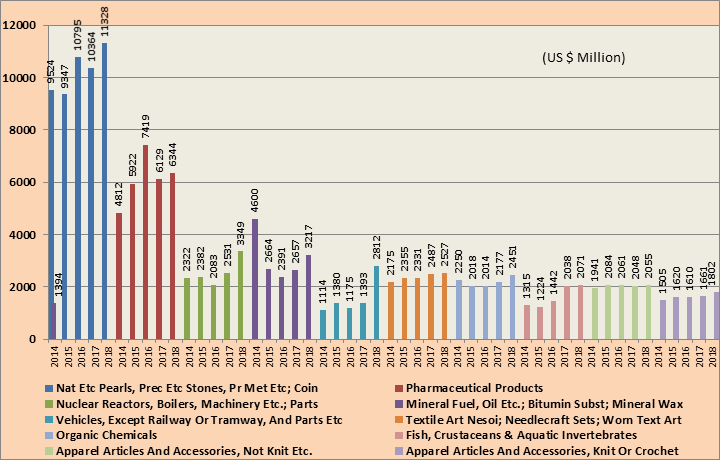
5 Year Trend Analysis of the Top Ten Export items of India to US
5 Year Trend Analysis of the Top Ten import items of India from US
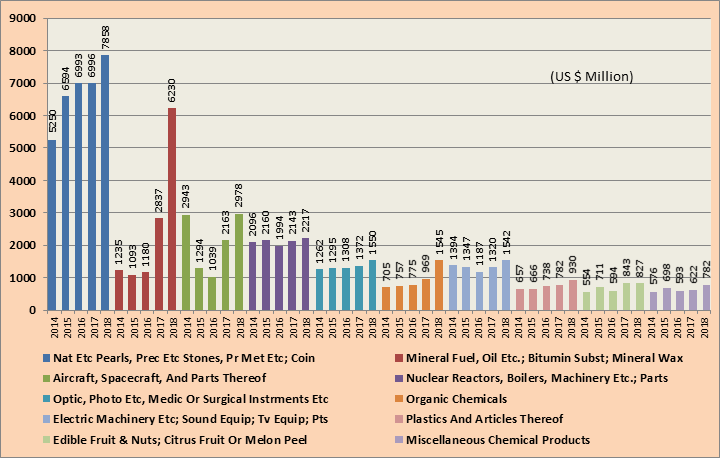
Source of Data: U.S. Department of Commerce, Bureau of Census
Bilateral Trade Trends during 2019
India's Exports to the U.S. - Top 10 Items
January – Oct 2019
|
HS Code
|
Commodity
|
US $ Million
|
% Share
|
% Change 2019/2018
|
|
71
|
Nat Etc Pearls, Prec Etc Stones, Pr Met Etc; Coin
|
9165
|
18.75
|
-7.58
|
|
30
|
Pharmaceutical Products
|
6419
|
13.13
|
21.33
|
|
27
|
Mineral Fuel, Oil Etc.; Bitumin Subst; Mineral Wax
|
3212
|
6.57
|
8.75
|
|
84
|
Nuclear Reactors, Boilers, Machinery Etc.; Parts
|
3108
|
6.36
|
11.98
|
|
29
|
Organic Chemicals
|
2374
|
4.86
|
16.24
|
|
87
|
Vehicles, Except Railway Or Tramway, And Parts Etc
|
2276
|
4.66
|
-2.81
|
|
63
|
Textile Art Nesoi; Needlecraft Sets; Worn Text Art
|
2150
|
4.4
|
1.55
|
|
62
|
Apparel Articles And Accessories, Not Knit Etc.
|
1911
|
3.91
|
5.2
|
|
03
|
Fish, Crustaceans & Aquatic Invertebrates
|
1784
|
3.65
|
4.82
|
|
61
|
Apparel Articles And Accessories, Knit Or Crochet
|
1667
|
3.41
|
7.46
|
Source of Data: U.S. Department of Commerce, Bureau of Census
India’s Imports from the U.S. - Top 10 Items
January - Oct 2019
|
HS Code
|
Commodity
|
US $ Million
|
% Share
|
% Change 2019/2018
|
|
27
|
Mineral Fuel, Oil Etc.; Bitumin Subst; Mineral Wax
|
7026
|
24.55
|
26.51
|
|
71
|
Nat Etc Pearls, Prec Etc Stones, Pr Met Etc; Coin
|
5336
|
18.64
|
-21.15
|
|
88
|
Aircraft, Spacecraft, And Parts Thereof
|
2039
|
7.12
|
-4.5
|
|
84
|
Nuclear Reactors, Boilers, Machinery Etc.; Parts
|
2011
|
7.03
|
13.39
|
|
29
|
Organic Chemicals
|
1622
|
5.67
|
31.41
|
|
90
|
Optic, Photo Etc, Medic Or Surgical Instrments Etc
|
1298
|
4.54
|
0.67
|
|
85
|
Electric Machinery Etc; Sound Equip; Tv Equip; Pts
|
1280
|
4.47
|
0.79
|
|
39
|
Plastics And Articles Thereof
|
798
|
2.79
|
4.62
|
|
08
|
Edible Fruit & Nuts; Citrus Fruit Or Melon Peel
|
688
|
2.4
|
0.89
|
|
38
|
Miscellaneous Chemical Products
|
628
|
2.2
|
6.68
|
Source of Data: U.S. Department of Commerce, Bureau of Census
Bilateral Investments
Indian data:
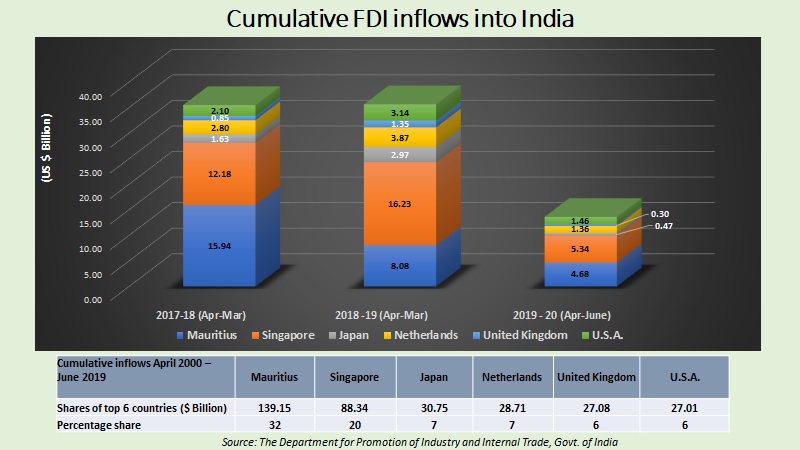
As per FDI statistics released by The Department for Promotion of Industry and Internal Trade, Government of India, the U.S. is the sixth largest source of foreign direct investment into India. The cumulative FDI inflows from the US during April 2000 to June 2019 amounted to $ 27.01 billion constituting 6% of the total FDI inflows into India. During the current fiscal year, for the period April 2019 – June 2019, FDI from US stood at $ 1.46 billion. As per a report released in November 2017 by Confederation of Indian Industries (CII) titled "Indian Roots, American Soil", Indian investment in US amounts to $18 billion, based on a survey of 100 Indian companies across 50 states in US for this report.
US data:
U.S. FDI into India as on year 2018 amounted to $ 45.98 billion, whereas Indian FDI into the US amounted to $ 13.73 billion.
As on December 17, 2019
Contact Details
For general queries:
1. Ms. Suja K. Menon
Minister (Commerce)
Email: mincom.washington@mea.gov.in
2. Mr. Abu Mathen George
Counsellor (Commerce)
Email: ccom.washington@mea.gov.in
For trade related queries
Commerce Wing
Email: com3.washington@mea.gov.in